This is the graphical debugger. It visualizes a series of RSX commands that had been dumped using the dbg-gui.
A frame can be reproduced command-by-command and the complete RSX state and all the associated textures and shaders can be viewed after each command.
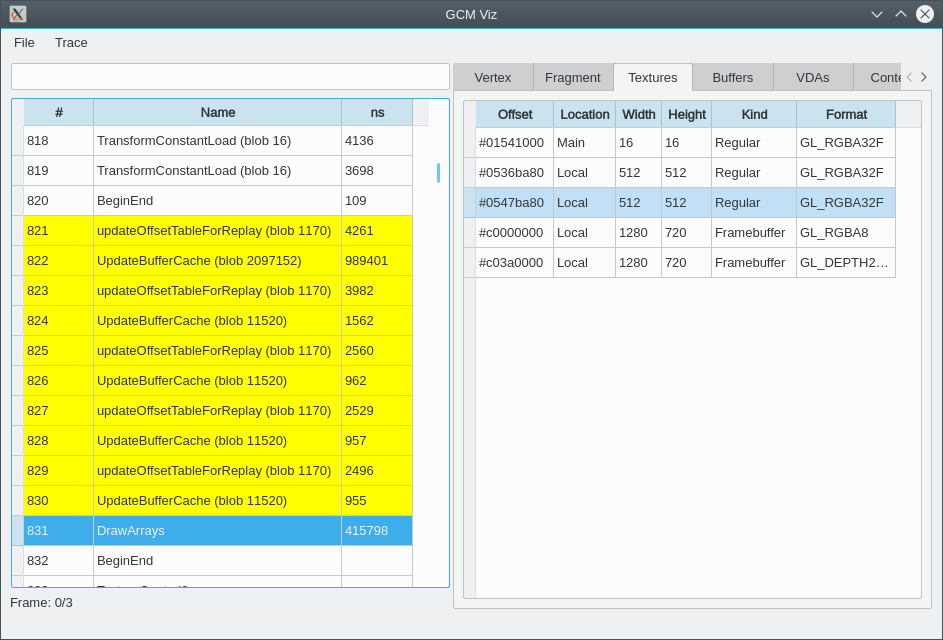
For example the following frame was produced using several hundred DrawArrays commands.

After the first several draw commands the following part of the frame was drawn

To do so two textures were used
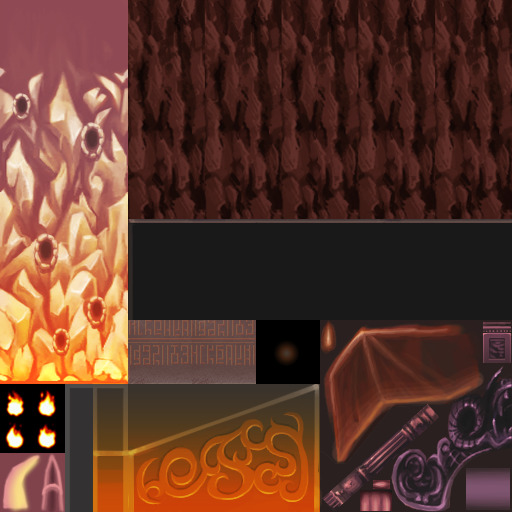
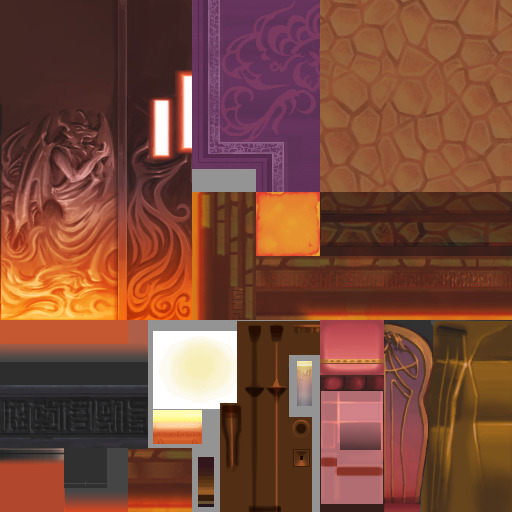
Also a fragment shader
000|000: TEXR R1, f[TEX0], TEX0;
001|001: MOVH H0, f[COL0];
002|002: FENCTR;
003|003: MULR R2, H0, R1;
004|004: FENCTR;
005|005: MULR R2, R2, f[TEX2];
006|006: MOVR R0.w, R2;
007|007: MULR R0.xyz, f[TEX1], H0;
008|008: MOVR R1.xyz, R1;
009|009: MADR R0.xyz, R0, R1, R2; # last instruction
That in turn was translated into the following (abridged) GLSL
r[1] = tex0(f_TEX0);
h[0] = f_COL0;
while (false) { }
r[2] = (h[0] * r[1]);
while (false) { }
r[2] = (r[2] * f_TEX2);
r[0].w = r[2].w;
r[0].xyz = (f_TEX1 * h[0]).xyz;
r[1].xyz = r[1].xyz;
r[0].xyz = ((r[0] * r[1]) + r[2]).xyz;
It is also possible to see e.g. how the Surface was configured, what vertex data attributes were used and what their formats are.